Monitoring and tracking down errors
Forget about error reproduction
Debugging frontend issues often gets complicated due to the amount of factors that have to be taken into account - device, browser and OS types, network conditions, etc. Sometimes even trivial hiccups consume a ton of time to uncover since the underlying circumstances can vary to a significant degree from one case to another.
Coview drastically simplifies debugging by letting you quickly get down to the bottom of issues your customers might be facing when interacting with your website. We inspect and vigilantly observe customer's session so you don't have to ask customers to locate and send you any information required for debugging their issues:
- All errors are caught with their complete stack traces and you can jump to any position position in the source code straight away using our built-in code viewer with an option to pretty print minified code
- Interaction events (e.g. clicks / taps and key presses) triggered by customers are captured in a coherent timeline, with the exception of passwords fields and any elements explicitly marked as private)
- You can see essential information about customer's environment: device type and its screen dimensions, OS version and browser stats
- All downloaded files associated with the session are listed along with their timings, sizes and origins
- Automatic browser health review: outdated cache detection, browser compatibility check and detailed performance report in case the website was slow to load
All of it enormously accelerates the issue resolution process by ditching the error reproduction burden altogether.
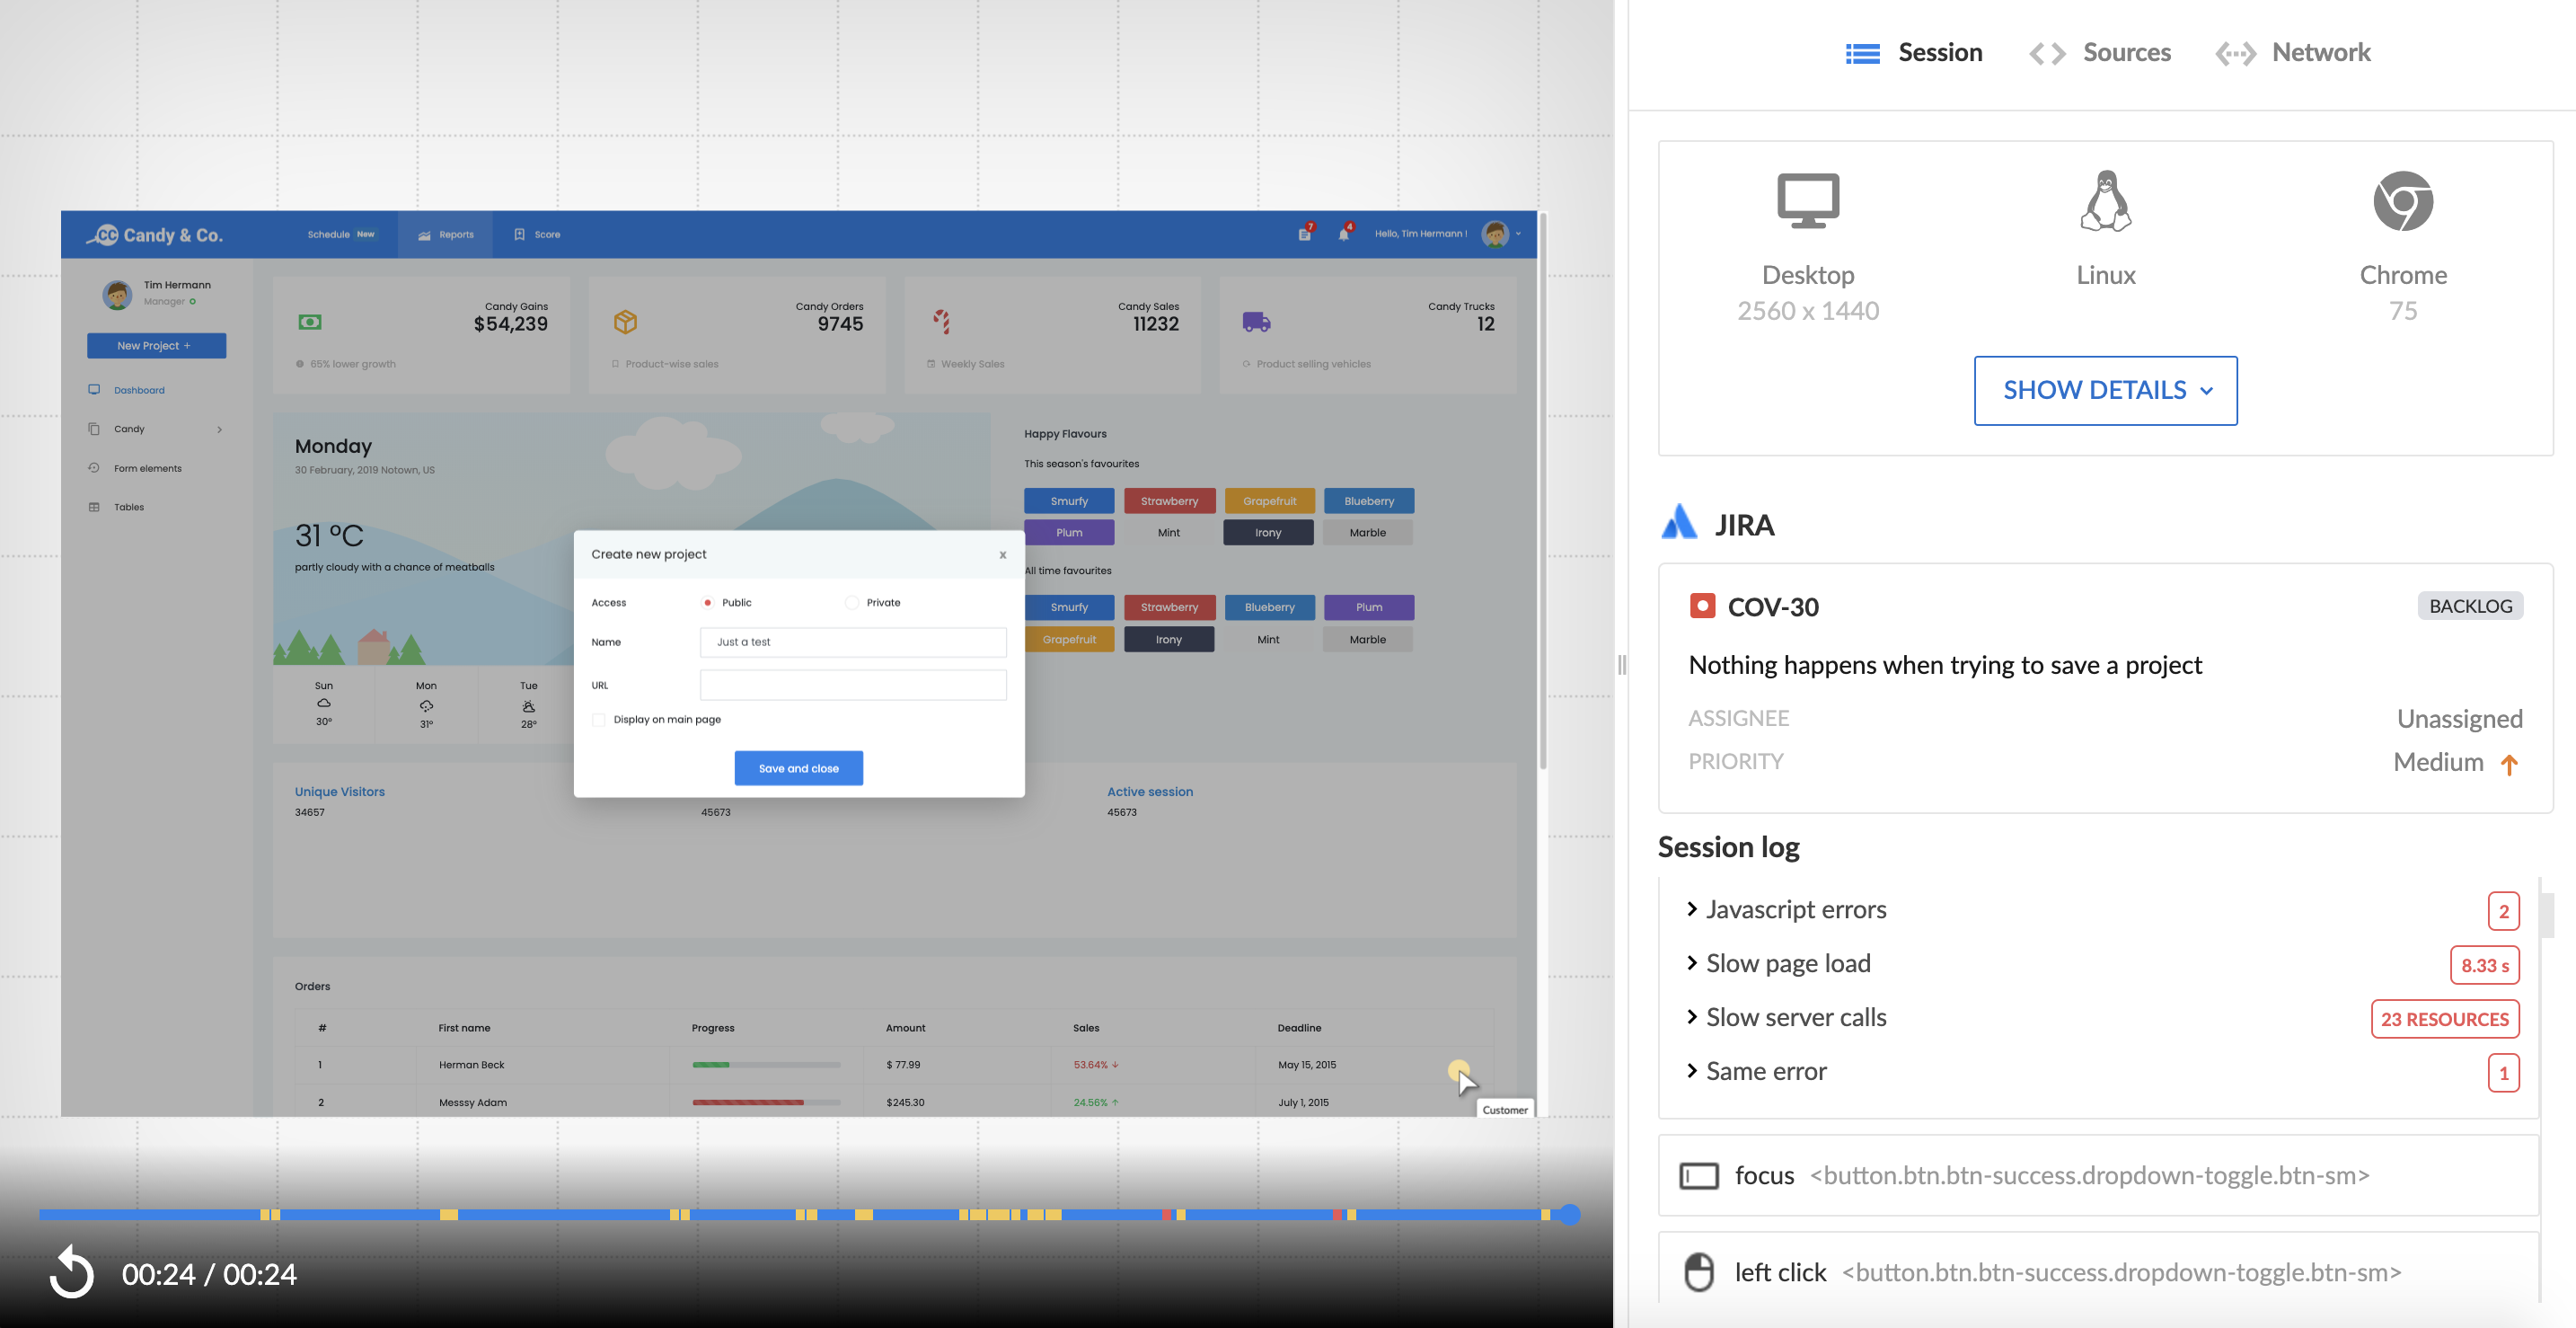
Screen recording and auxiliary data.
Recordings & replays
Screen recordings or co-browsing session replays aren't just flat videos as it may initially seem. In reality, they are full code snapshots of the webpage at any given moment, which means you can inspect them with devtools and "time-travel" through the series of events.
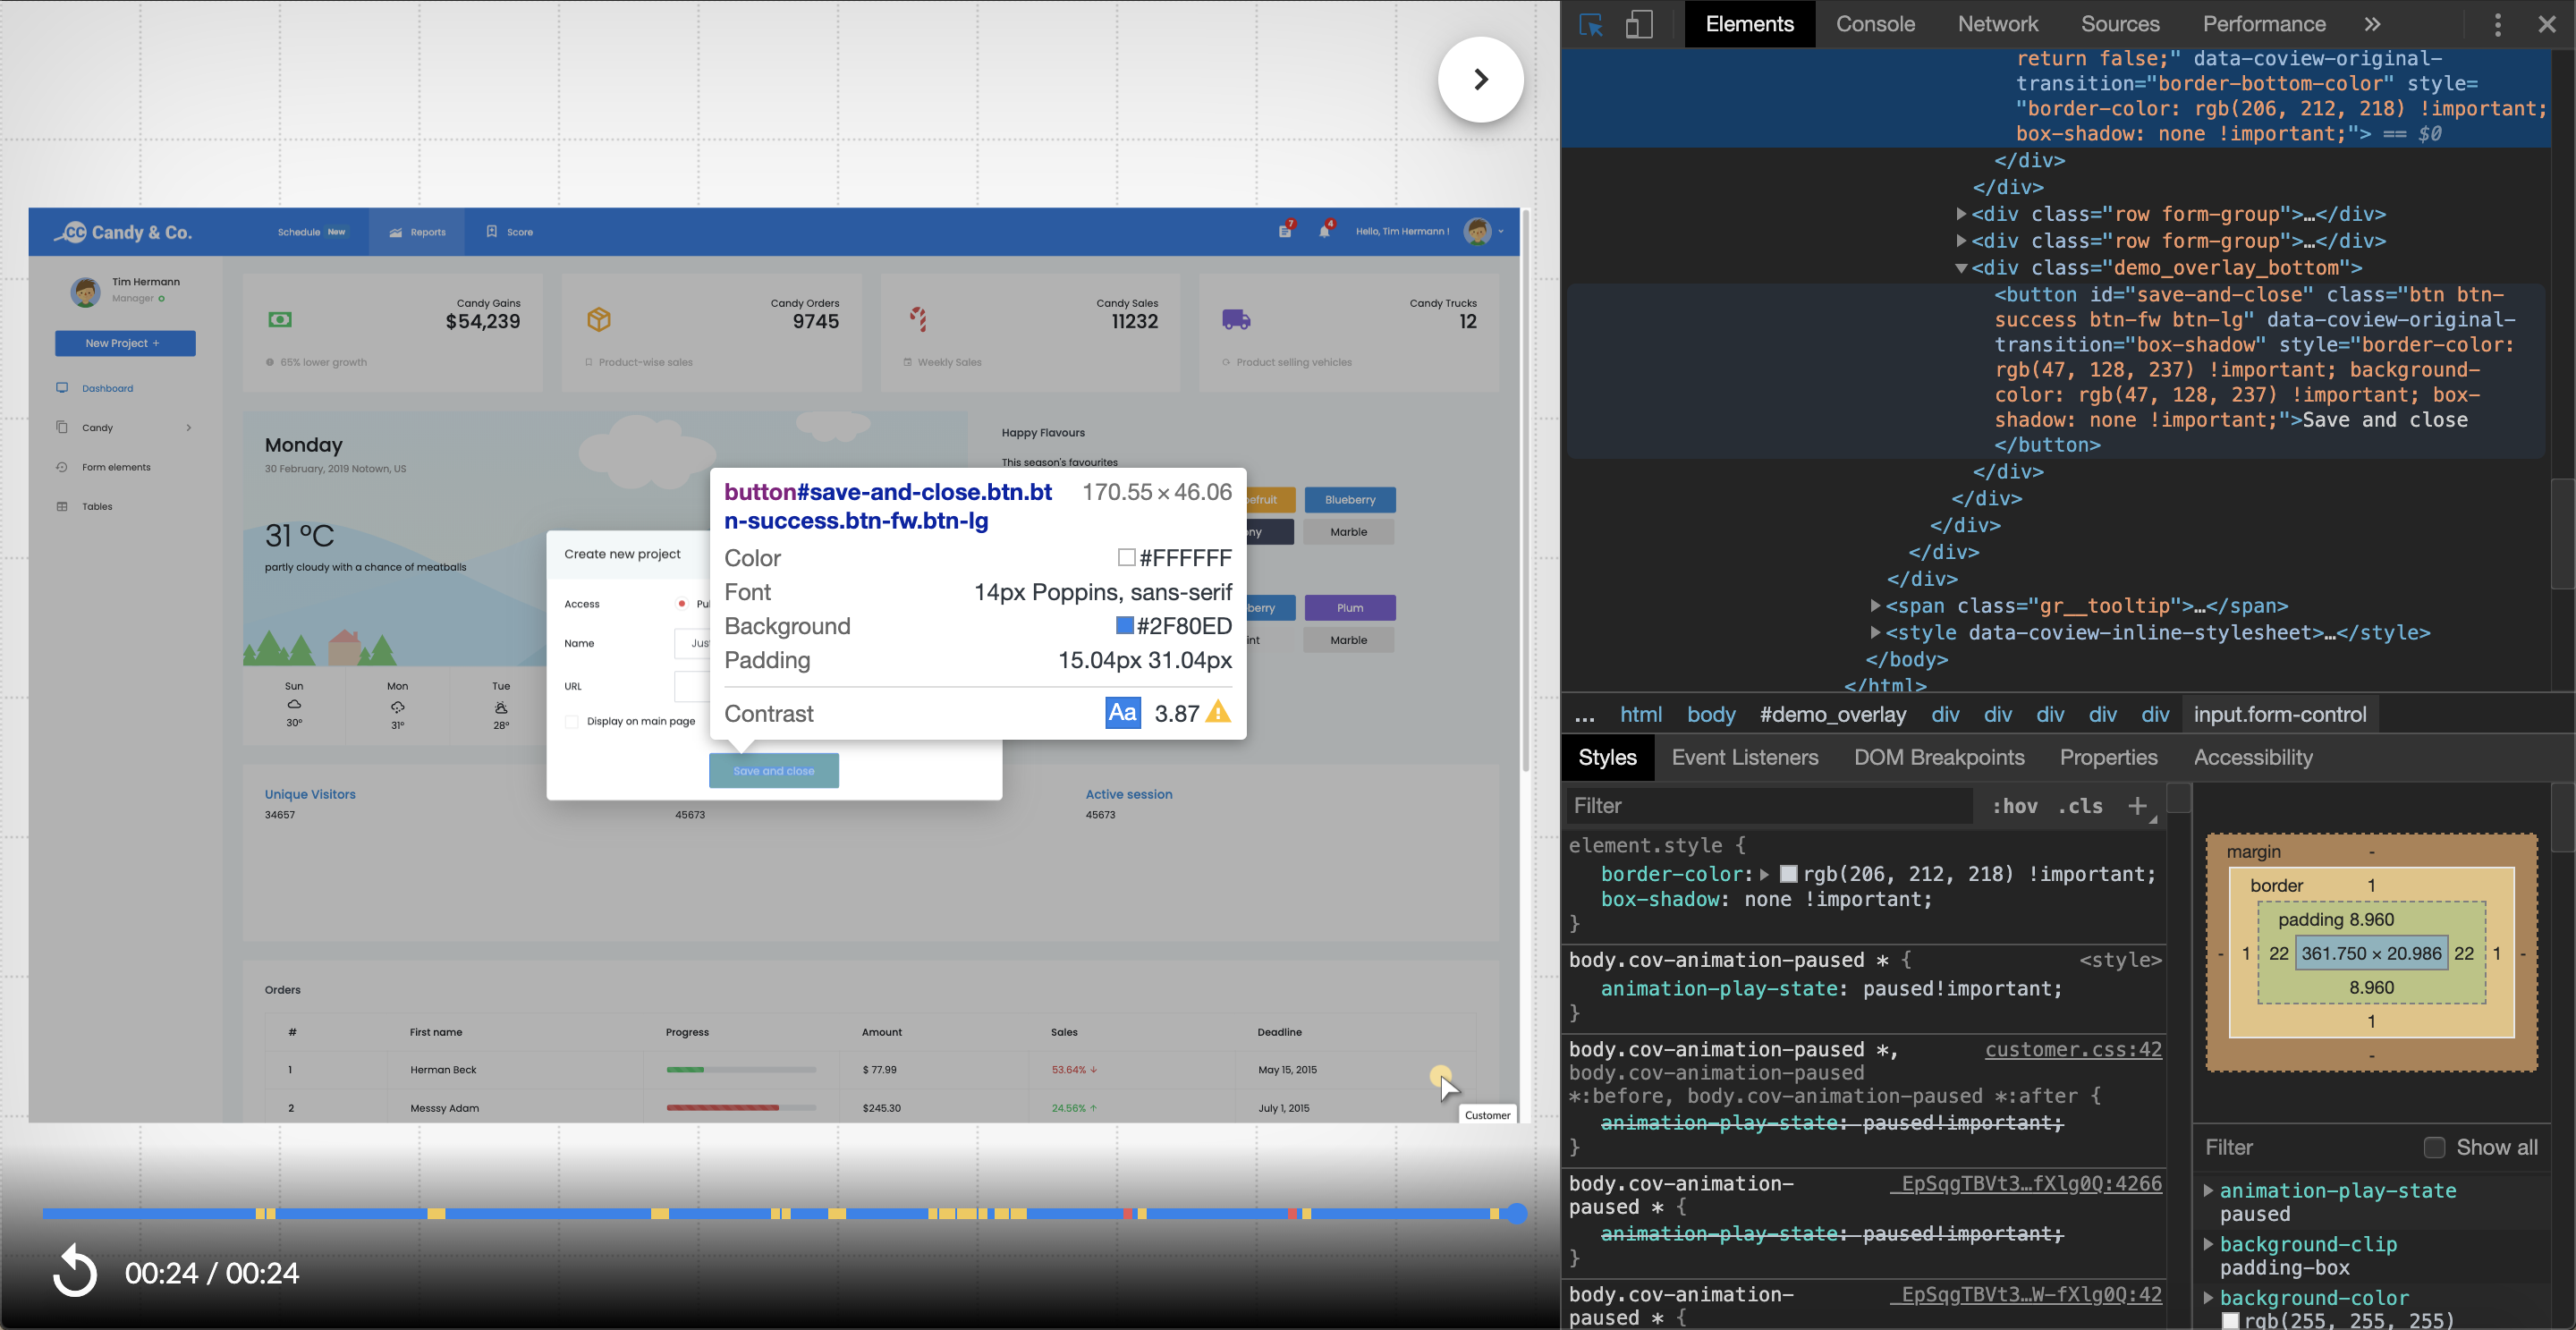
Inspecting the recording with browser's devtools.
Markers on the timelineInteraction events are tagged with yellow color and JS errors are red.
Session log
One of the most frustrating experiences in customer support is when customers run into some problem on your website and the support team spends hours agonizing over its reproduction.
Coview got your back here - it keeps an action sequence log which allows to quickly trace back
to a bug or an error that affected the customer.
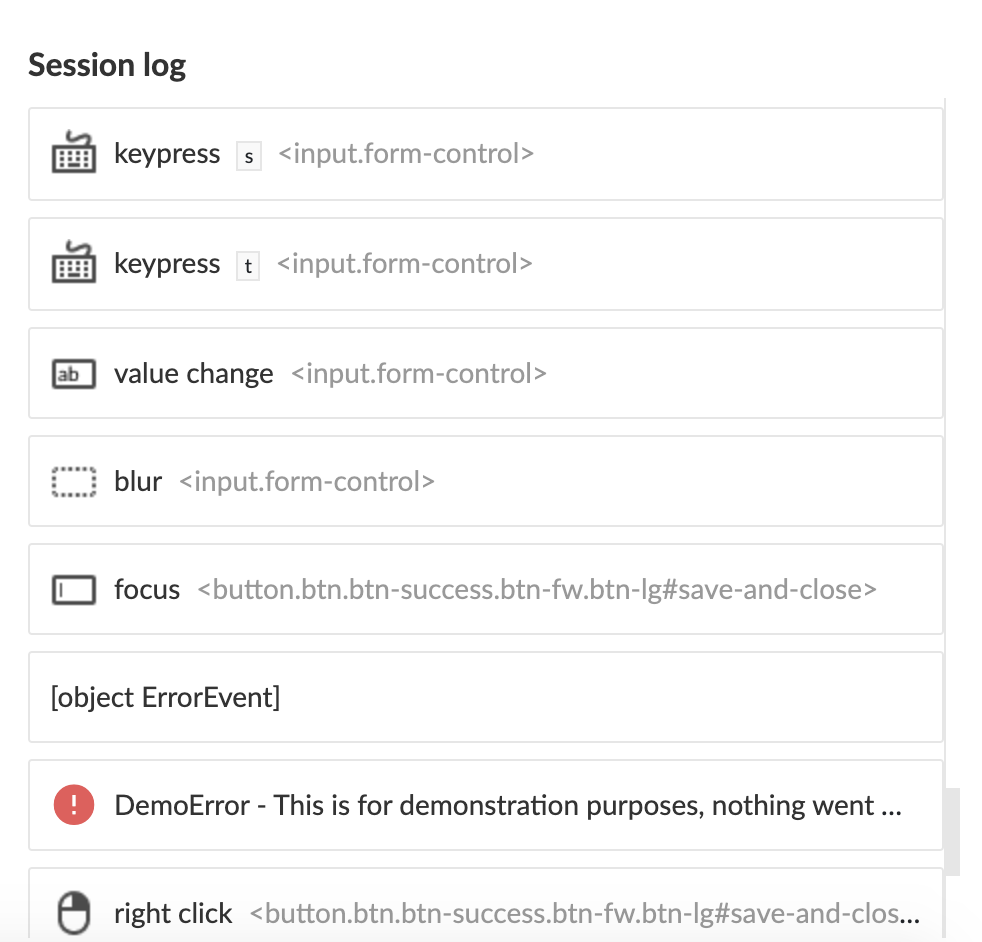
Event log.
⚡️Jump through events
When you click on an event, the recording will be rewound to the exact moment of time when it happened.
Errors
An error event entry could be expanded to unveil a complete stack trace:
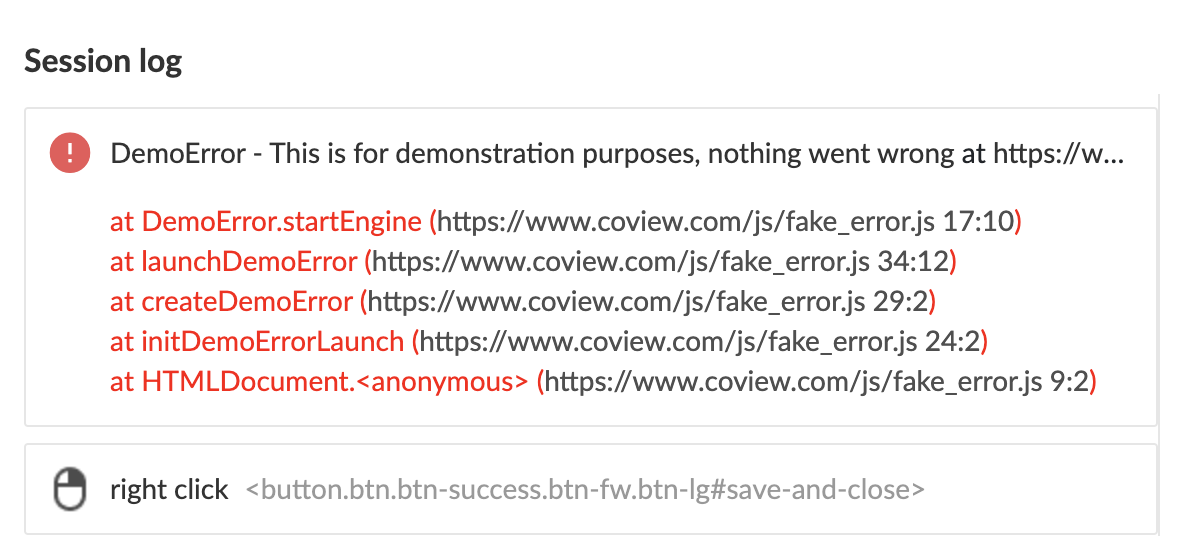
Error's stack trace.
Clicking on any stack trace record will take you to the associated line in the source code:
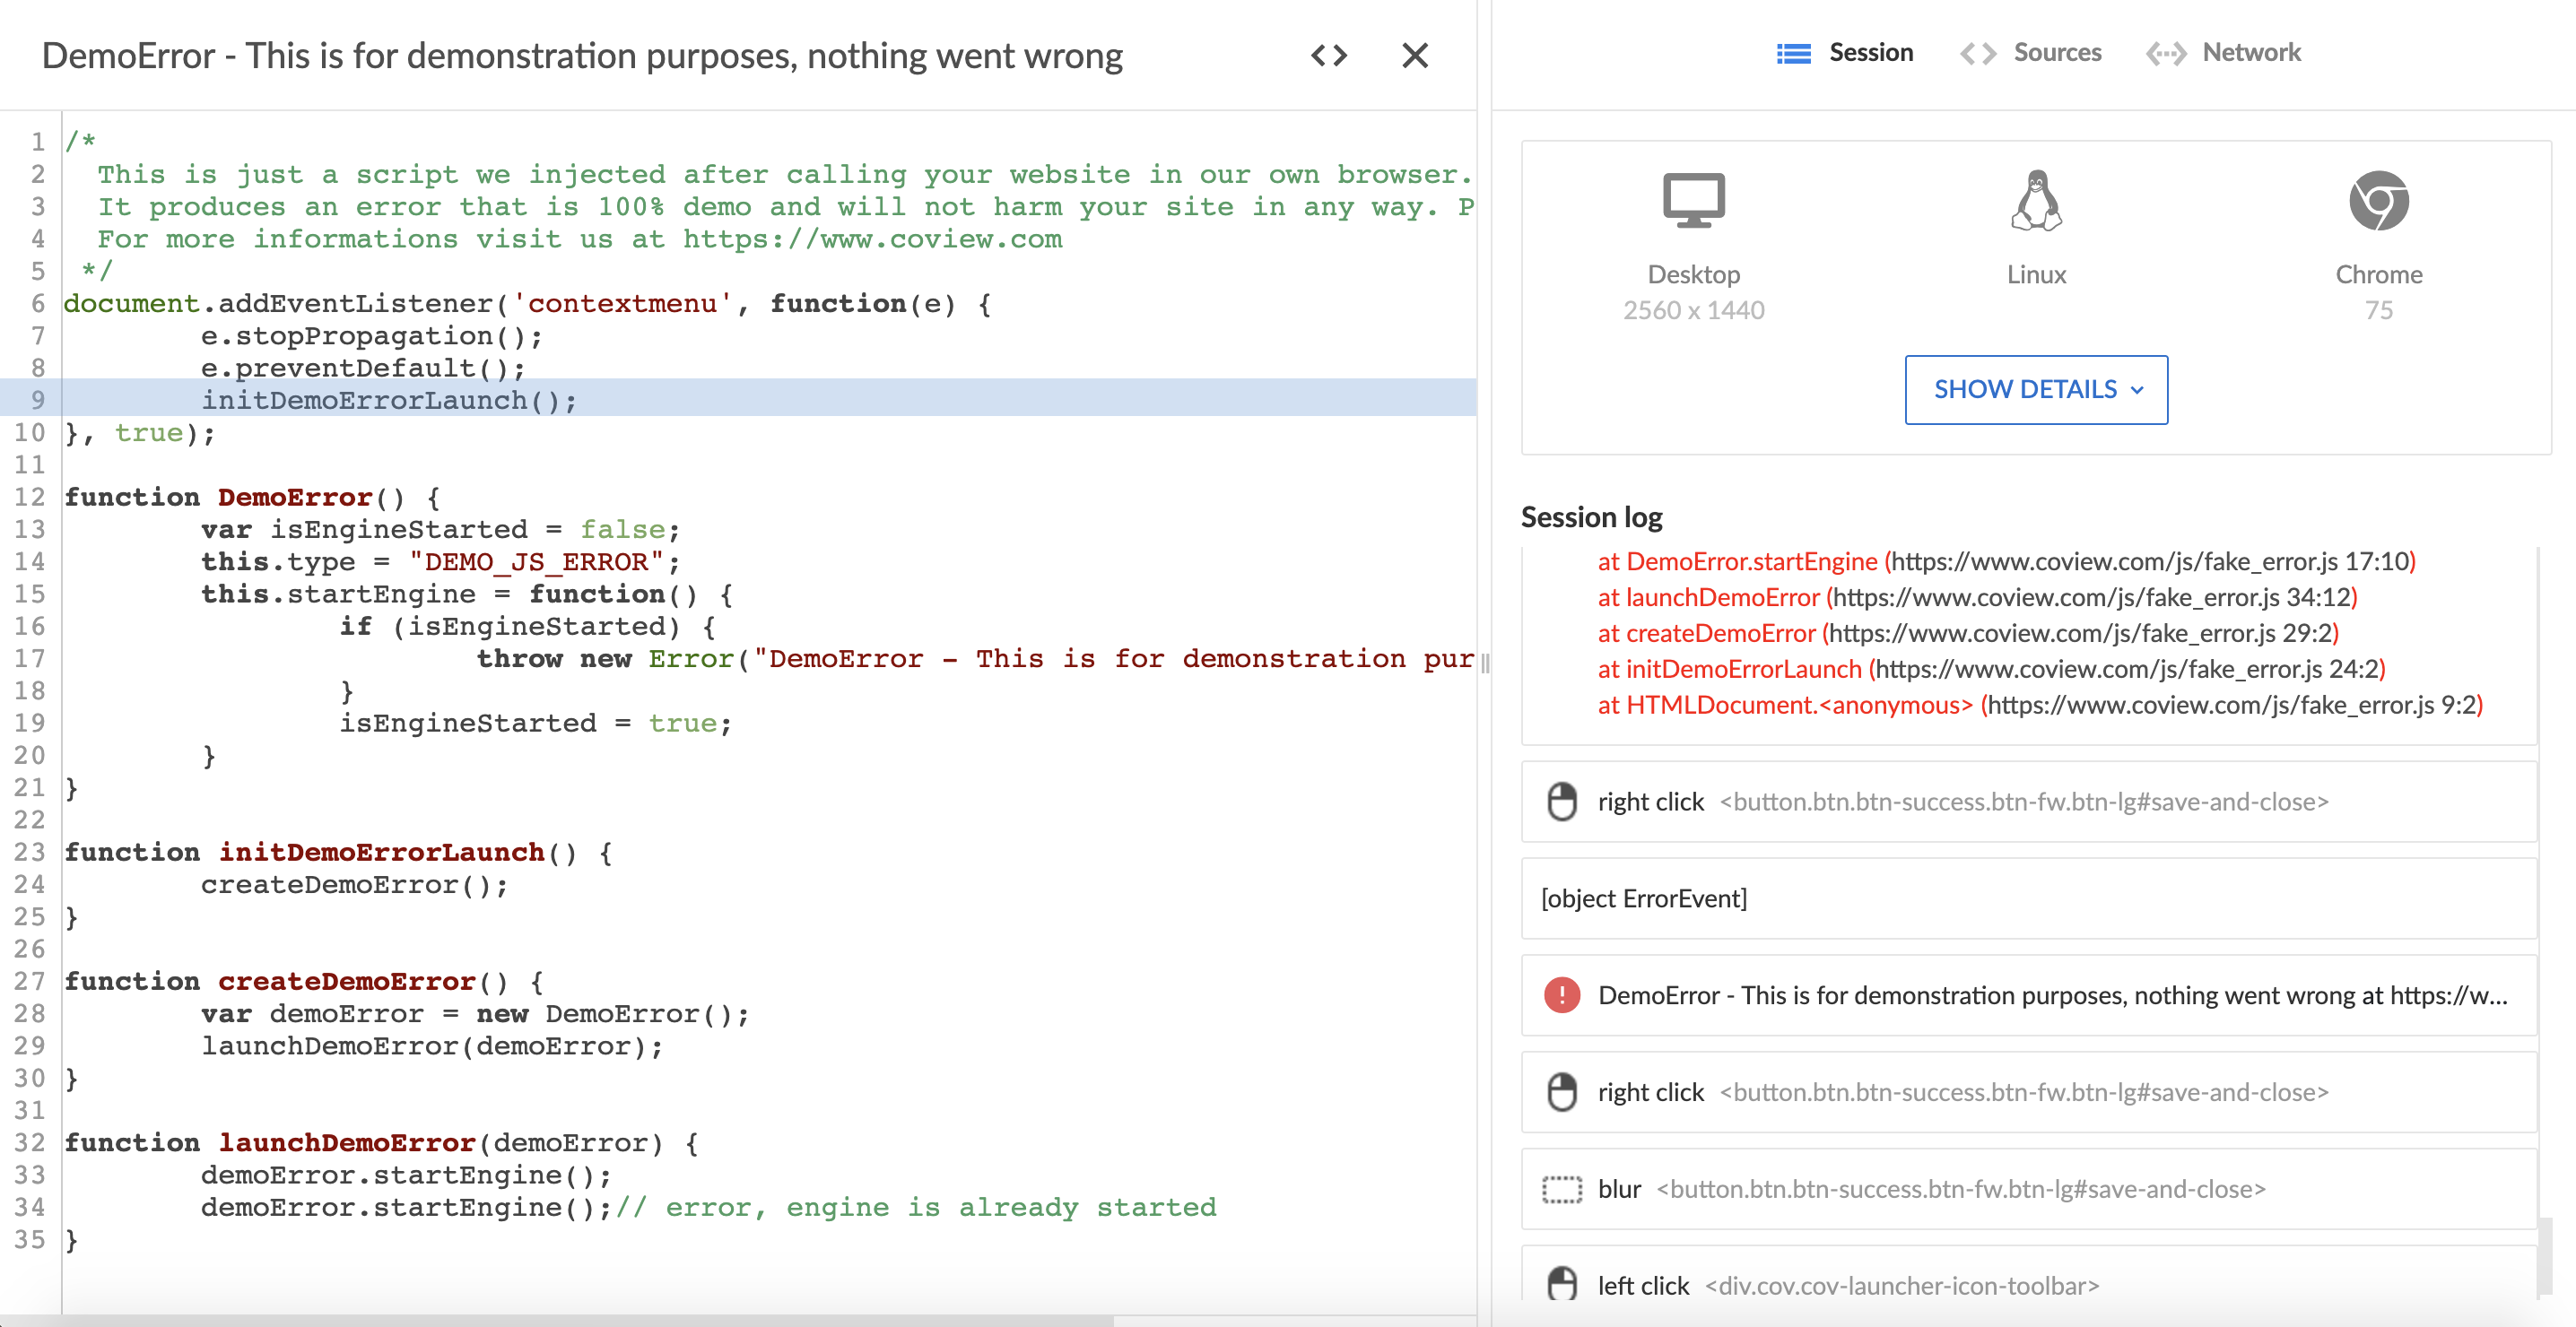
Highlighted line in the source code.
Browser health checks and performance reports
Session log shows few other things:
- If our automatic browser health checkup surfaced any issues with a customer's browser or cache, you'll see a warning
- If the webpage took a significant time to load (above typically recommended threshold), we'll include performance metrics and indicate the slowest resources
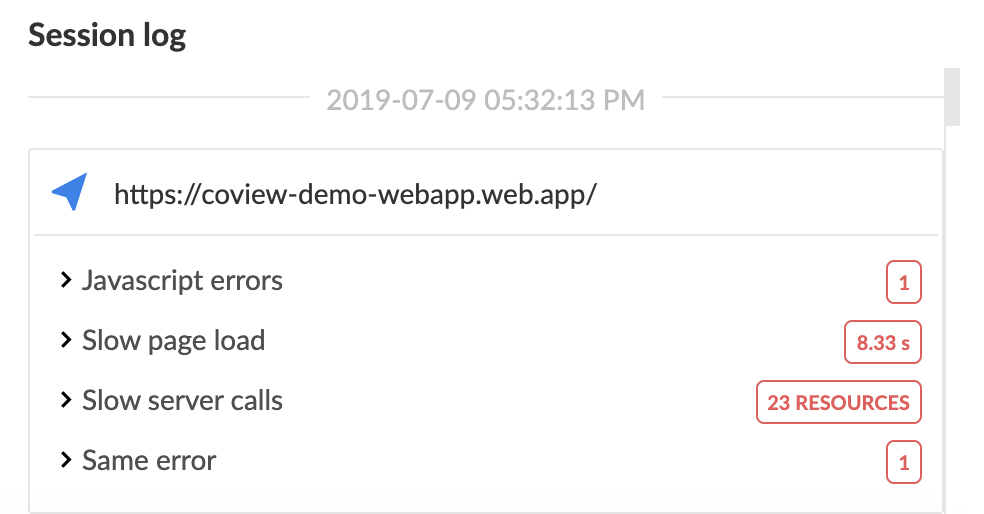
Error and performance summary.
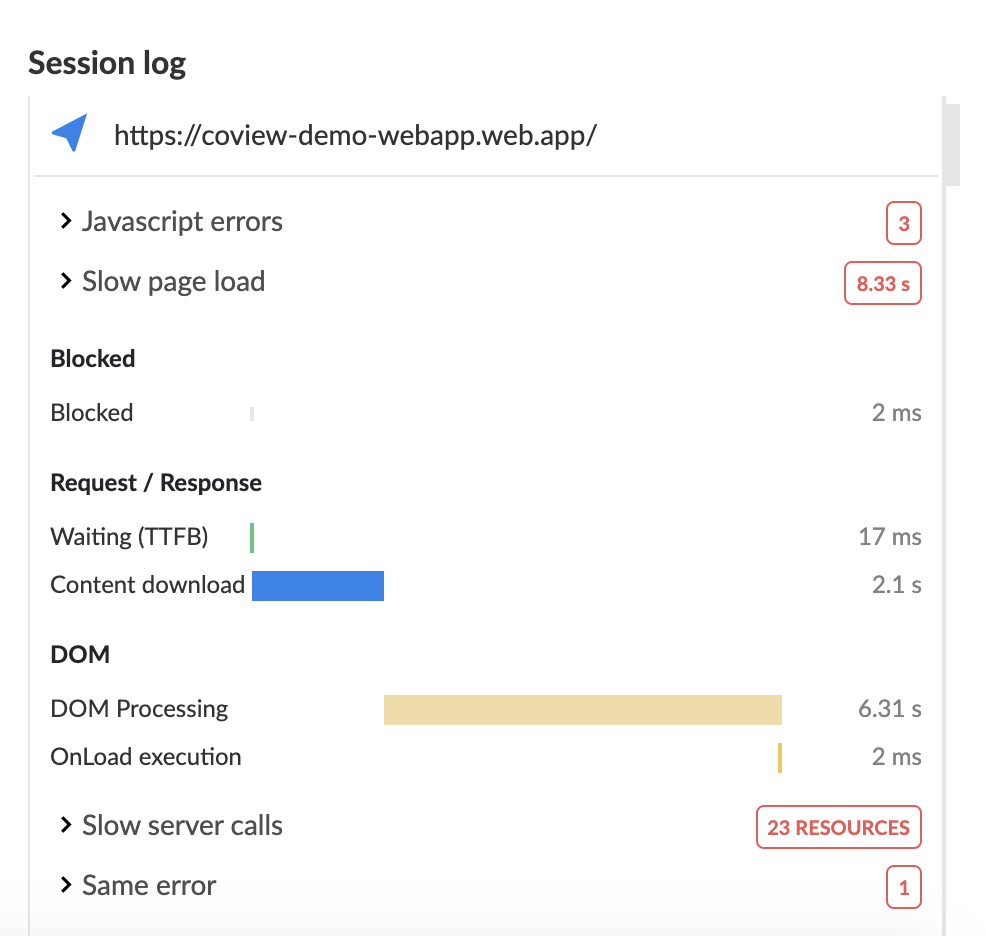
Performance metrics.
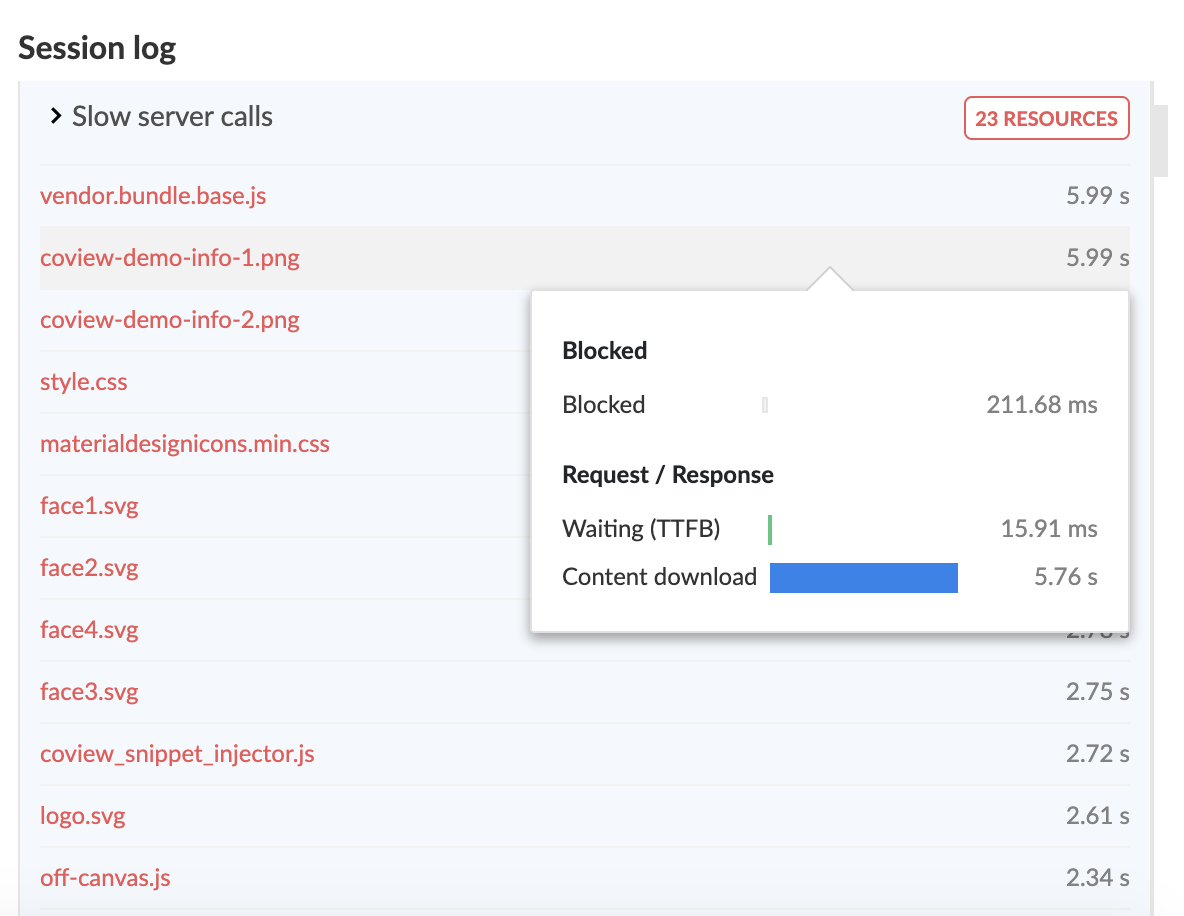
List of resources marked as slow to load.
Session context
This section is comprised of three tabs described below.
Session tab
Contains device, OS, and browser stats.
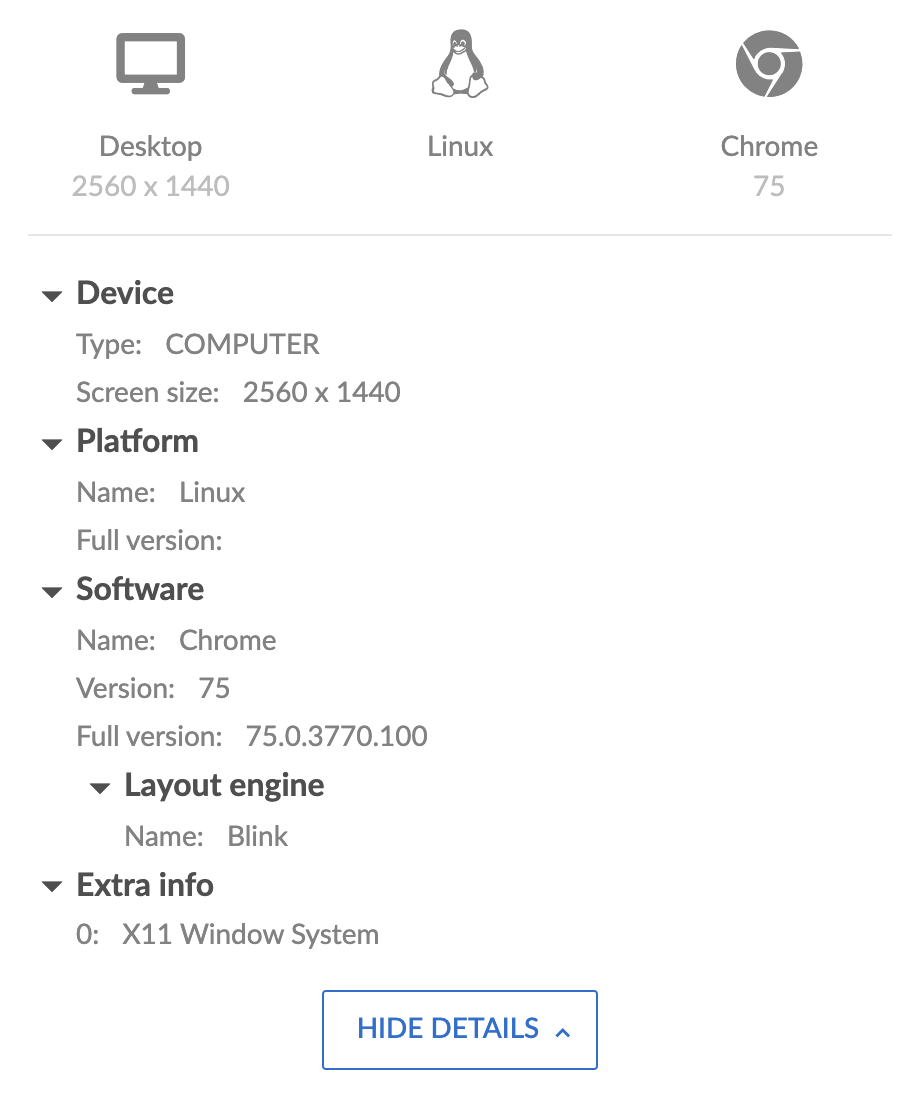
Session tab.
Sources tab
Shows a list of source files loaded by a customer’s browser.
When you click on a file, it will be expanded on the left in a minimalistic code viewer with syntax highlighting and an option to pretty print.
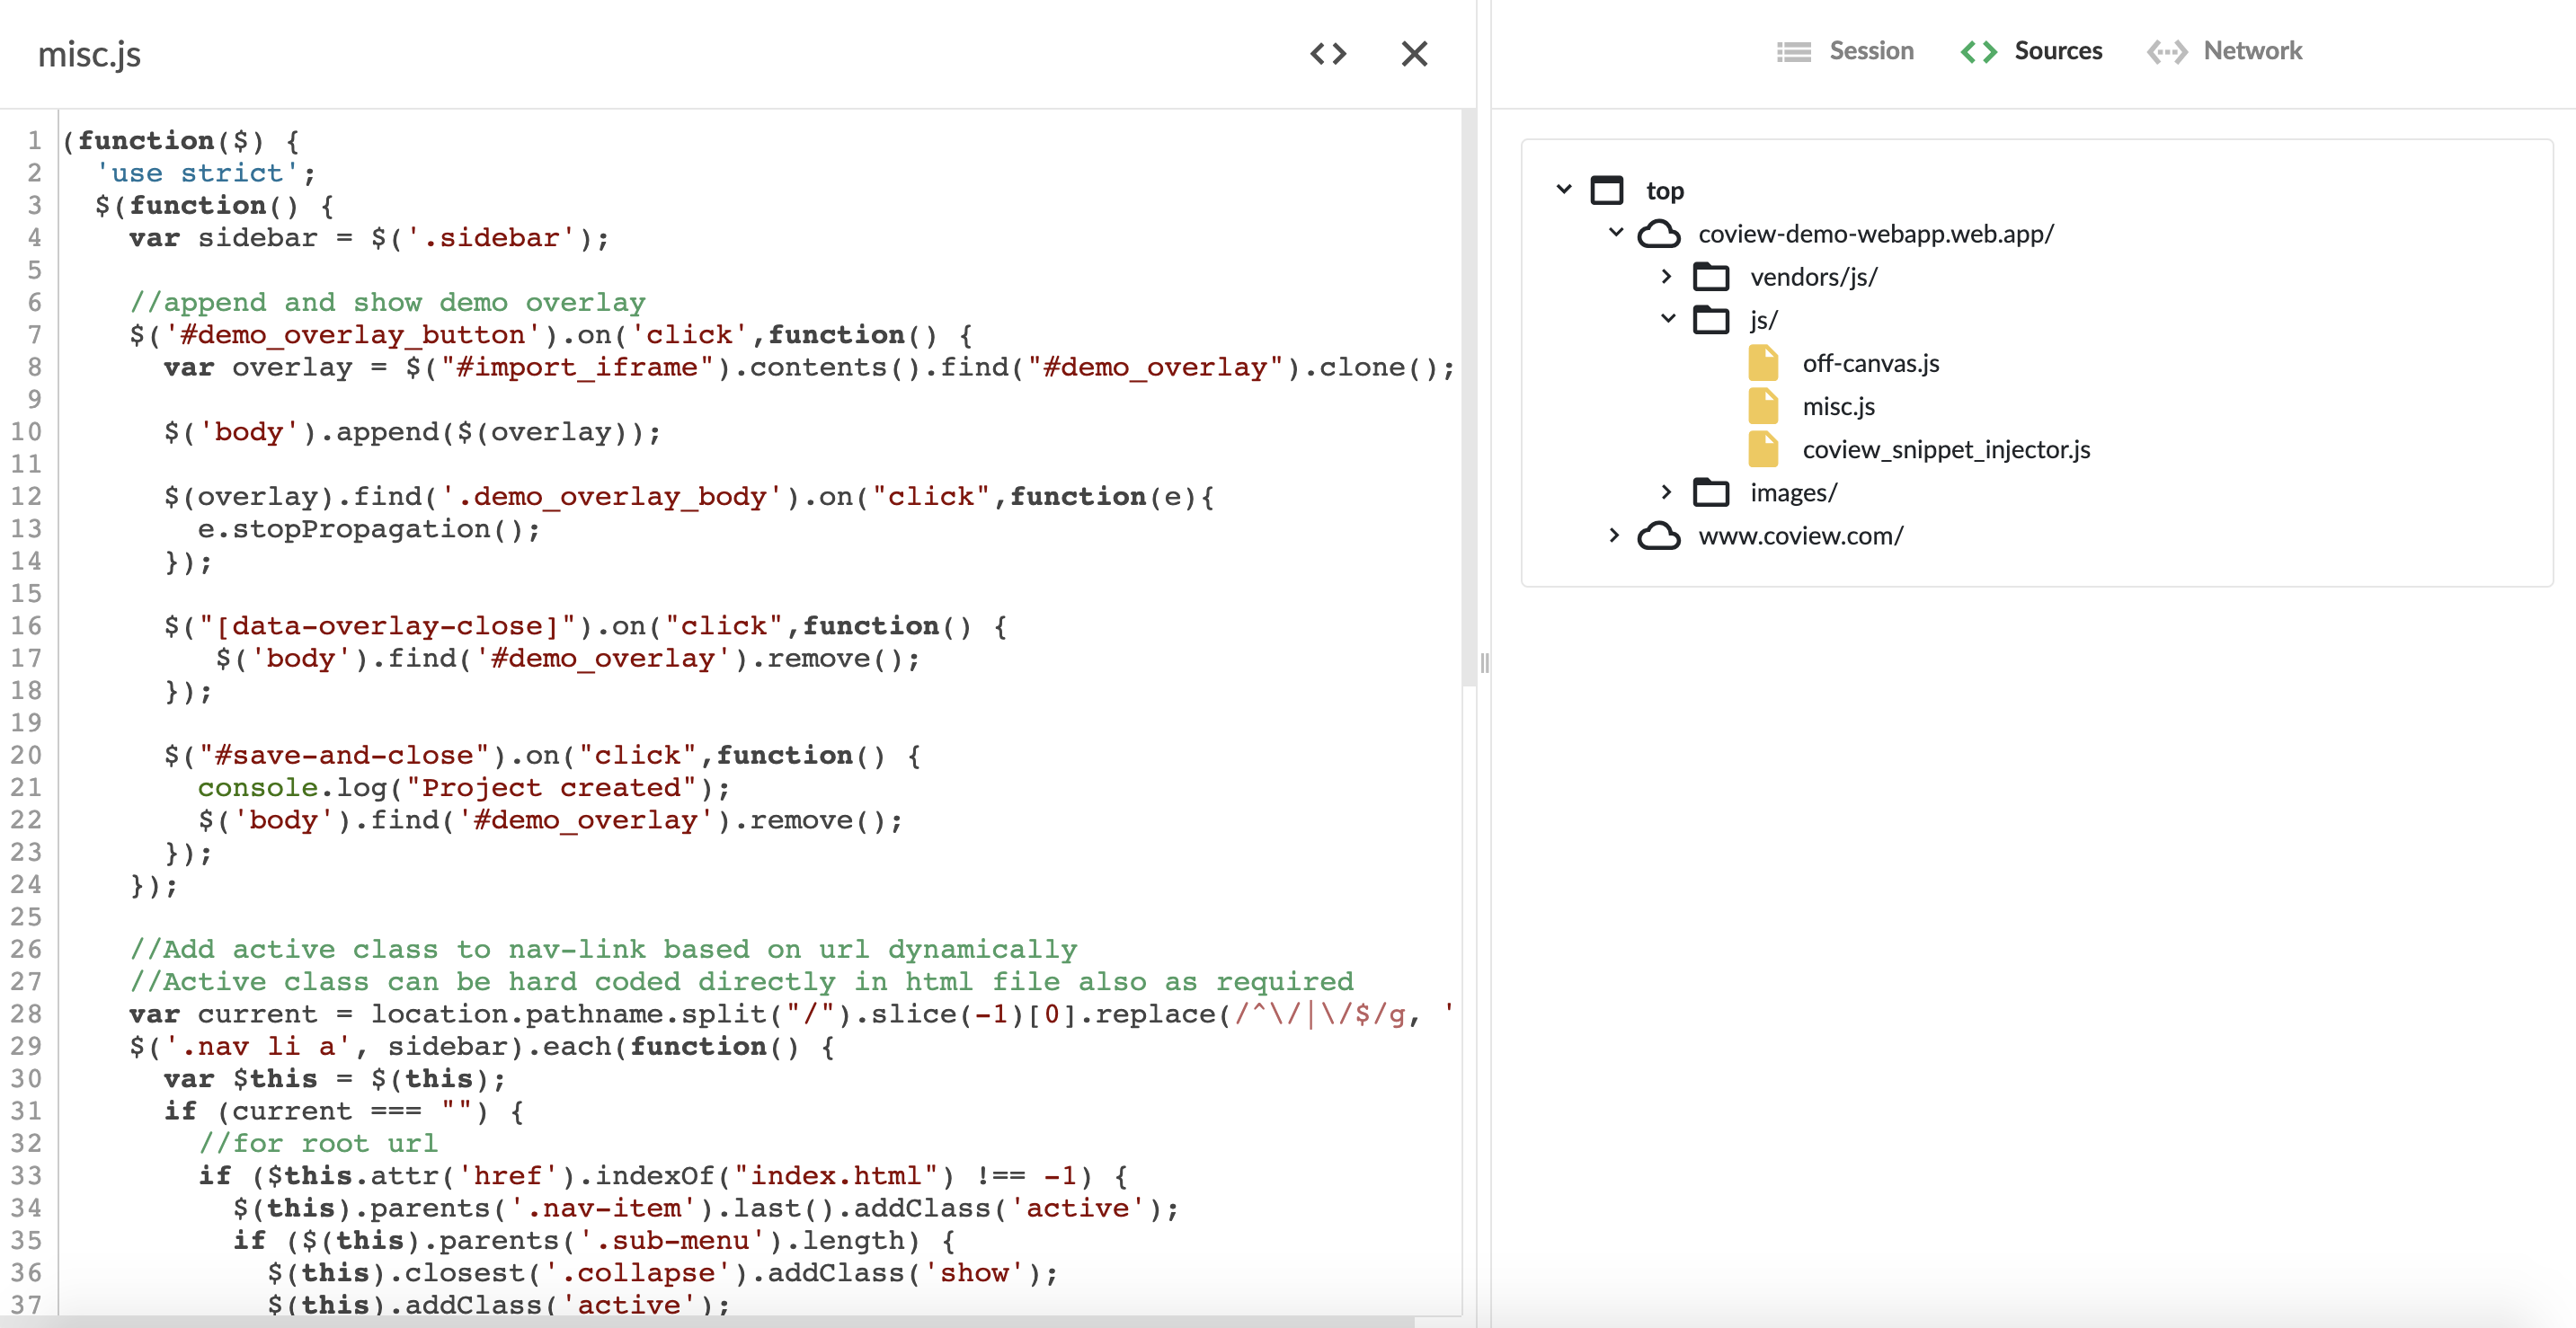
Sources tab.
Network tab
Outlines all page resources associated with the session along with their timings, sizes and origins.
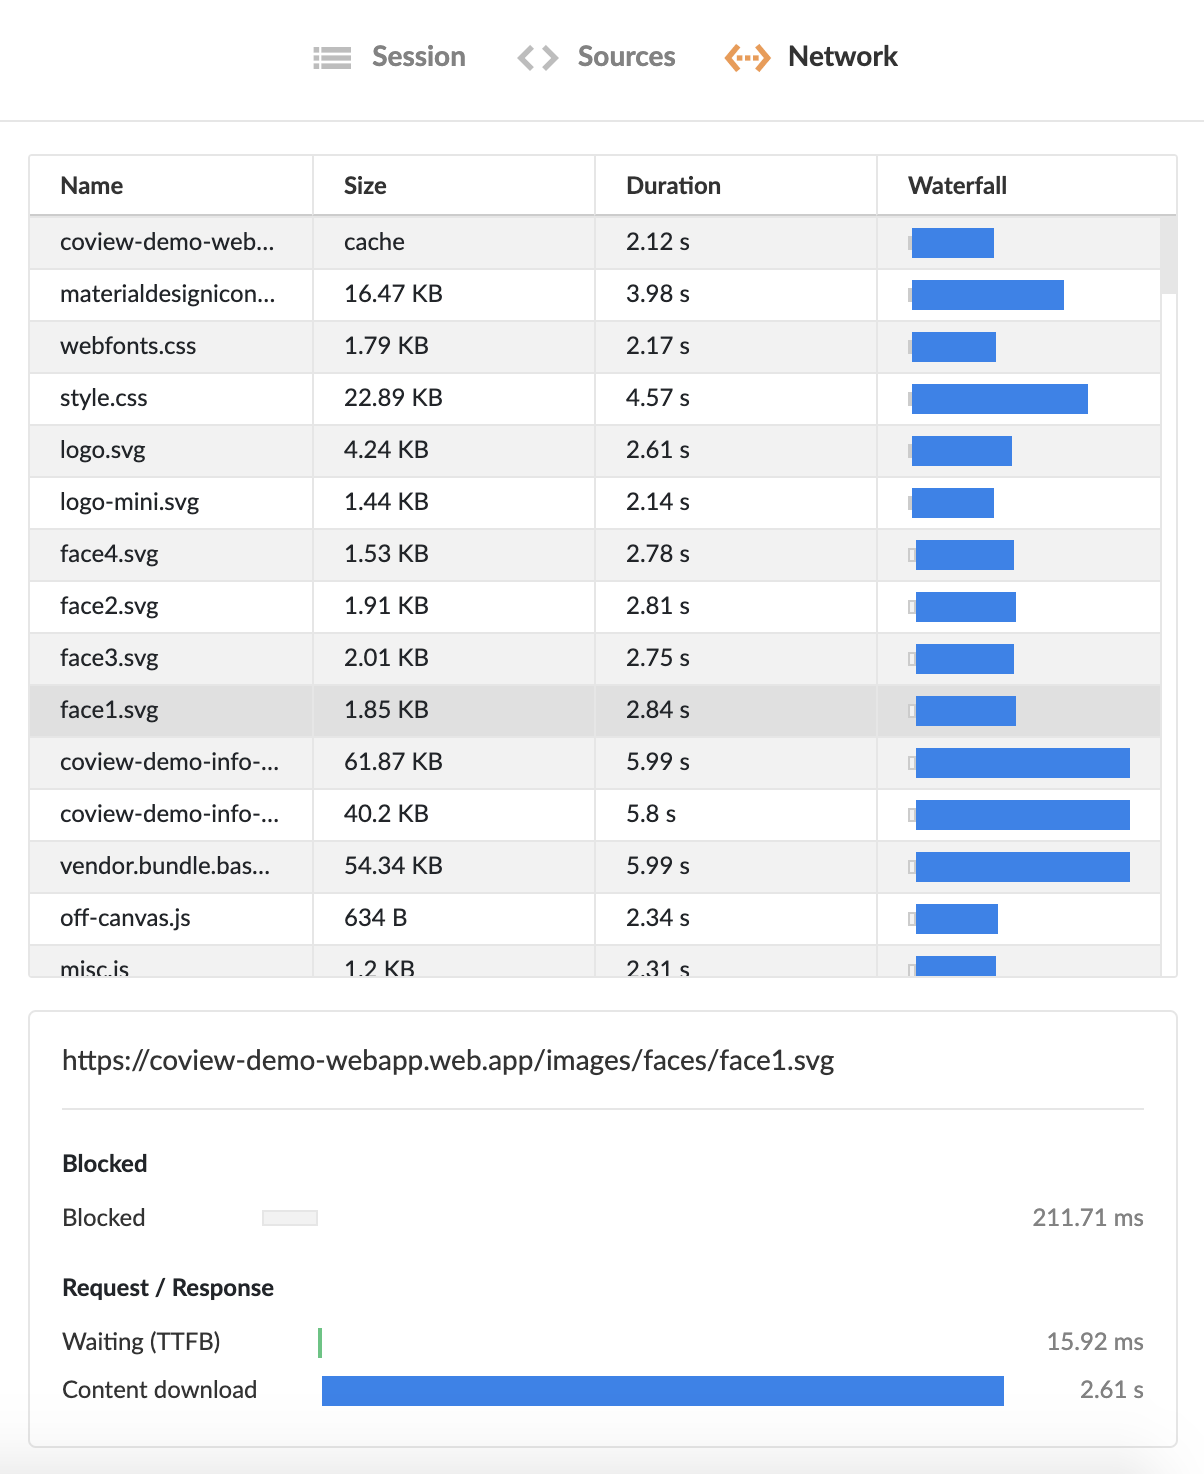
"Network" tab.
Updated 7 months ago
